Following is an article noting some of the features of the NBSC Player and Recorder Softwares.
This is not an exhaustive help system!
Available from from the downloads section of this site is the NBSCPlayer packager. This package contains two applications:
This article outlines some of the features of both these applications.
It should be noted that when playing back files that features such as aperture simulation and colour reproduction take considerable computing power and playback (and recording) may be quite jerky and the sound may break up on older or less powerful computers.
This software has been tested on Windows XP, Windows 2003, Windows Vista and Windows 7. It may or may not work on earlier operating systems. This software requires the Microsoft .Net Framework 2.0 to be installed.
The Player software can be used to play back NBTV files contained in WAV files conforming to the following standards:
You must select the right playback 5. Standards, formats, filters for the file to be played. However, the formats are all to some extent "compatible" in that those sharing the same number of lines will play back when the wrong standard is selected however colour information may be incorrect or missing.
To get started download the sample test cards files from the Downloads section of this site and open them with the player. (Click the File->Open menu option and load the file).
Note: When playing back a file you may resize the window to get a larger display. However it should be noted that older, less powerful computers this can cause motion to become jerky due to the computer struggling to cope with the workload.
You can capture the current frame of video by using the File->Capture menu option or by pressing CTRL-C, however please note that in the current version of the software this function can lead the software to crash.
The player window has a set of "user controls" (the row of "knobs" at the bottom of the screen) much like a standard television:
For most playback purposes the mid-positions of the controls will suffice. To reset a control to its mid position double-click it. To adjust a control using the mouse click and drag the control to rotate it just like a normal rotary control. For finer control click on the outer edge of the control and whilst holding down the mouse button move the mouse radially out from the control, you now can make fine adjustments. Alternatively you can click once on a control and then use the cursor (arrow) keys to make small adjustments.
The player also has a set of "option" controls for fine-tuning the behaviour of the system, especially useful for experimenting!
This causes the image to be "smoothed" as it is being scaled up to the screen. This option has little effect and is best left off.
For NBSC decode using the IQ vectors instead of the UV vectors (see Splitting up the colour into components (default:off)
Scan in normal NBTVA scan order (i.e. bottom-right to top-left) as opposed to wide-screen (i.e. top-right to bottom-left) (default:off)
For NBSC standards enable the automatic colour killer, the colour circuits are disabled if a colour burst is not detected. (default:on)
The luminance signal is muted (set to mid-grey) for colour signals the colours will still be visible (default:off)
The U signal is muted (or I if Use IQ is enabled). Only partial colour information will be in effect giving a reduced colour picture
The V signal is muted (or Q if Use IQ is enabled). Only partial colour information will be in effect giving a reduced colour picture
Enable the Comb filter(default:off)
The comb filter can be used to mitigate the problems of cross-colour and dot-patterning at the cost of a reduced resolution across the lines. Briefly a comb filter takes the average of two adjacent lines to form the luminence signal (this removes the dot-pattern which is equal and opposite on adjacent lines) and takes the difference of two adjacent lines to form the chroma signal (this removes the luminence signal which is roughly the same on each line). More information about comb filters can be found here.
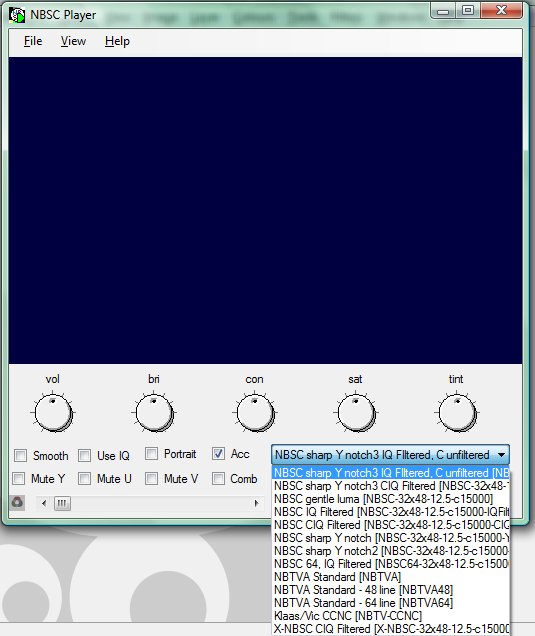
The player and recorder each has a set of pre-determined "standards". For the NBSC colour standards a set of extra "filters" are also present which are used to shape the frequency responses of the various channels. Move the mouse over the currently selected standard for more details.
You need to select the correct standard for the file to be played back some standards are "compatible" with others, but the colours may not be reproduced, for instance choosing "NBTVA" to playback a colour file will result in the colour file being reproduced in black and white only.
Each standard may also have a set of filters applied, these filters affect the frequency response of the various channels during decoding of a signal. These filters can be used to decrease some of the undesirable side-effects of adding colour signals into the black and white bandwidth.
In general all the standards with the same number of lines are "compatible".
The table in A. Table of available standards lists all the available standards.
Note that not all standards are applicable to both recording and playback. In general recording is best performed with either NBSC-32x48-12.5-c15000-YN3 or NBSC-32x48-12.5-c15000-YN3IQ to minimise the effects of cross-colour and playback is best performed with NBSC-32x48-12.5-c15000-YN3IQ to best eliminate dot-patterning. However you are encouraged to experiment!
The filters that can be applied as part of a standard have various effects. Some of these are outlined here, however you are encouraged to experiment with different combinations of record and playback filters on different types of programme material - sometimes what looks good for test cards is not so good for real life material and vice-versa.
Note: In the current version of the software it should be noted that the playback filters only work correctly on 48kHz samples, with other sample rates the frequency response of the filters is incorrect.
This filter filters out frequencies at or near the sub carrier frequency from the Y (luminance) channel.
This leads to slight softening of sharp edges (along the line) for both playback and record though is barely noticeable
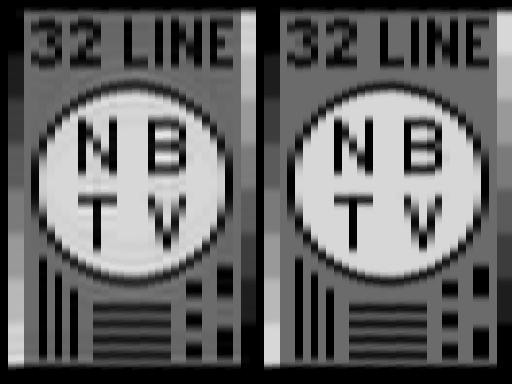
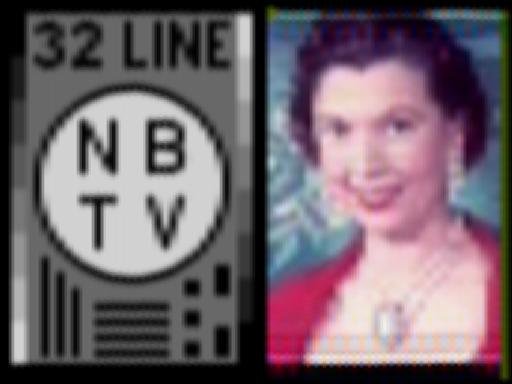
The figure above shows the slight differences between a notch filtered and unfiltered image. This is a black and white test card file with the filter being applied at playback - similar results are obtained when applying the filter when recording.
The filtered image is slightly softer than the unfiltered image, and there is some slight ringing on the sharp transitions.
The filter really comes useful on NBSC colour files. When applied at playback the filter can mask most of the effects of dot-patterning by removing the colour information from the black and white luminance channel.
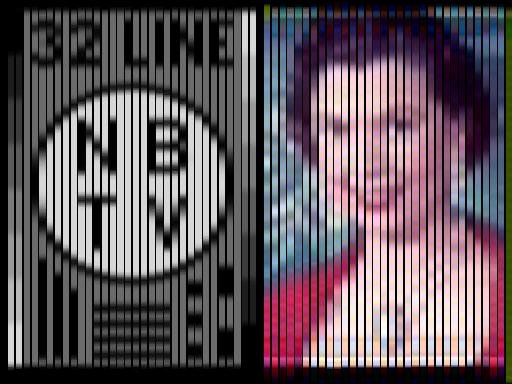
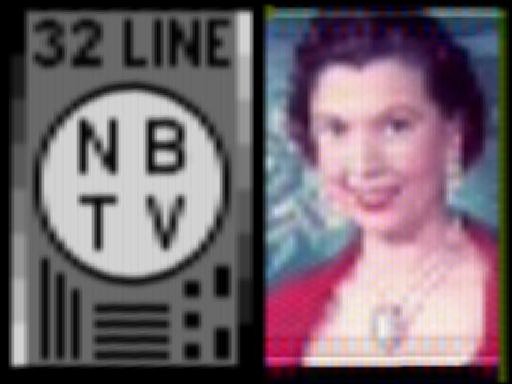
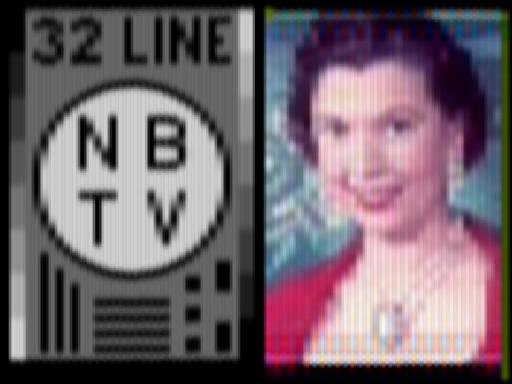
The figure above shows the big improvement effected by the notch filter in reducing dot patterning (during playback). Note that some dot patterning is still visible on sharp transitions of colour boundaries. This can be further improved on by reducing the C (chroma) bandwidth to remain within the bandwidth of the notch filter (see C filter below). In real life images such sharp colour transitions are rare and dot-paterning is not so evident when using a notch filter.
Note also that dot-patterning is further masked in real-world televisors by the large apertures used in, for instance, a Nipkow disc machine. This can be shown by using the 6. NBSC Player - Apertures
When the notch filter is applied at record time, the effect is different, now it will remove luminance information at around the sub-carrier frequency which would otherwise be picked up by the receiver (or playback software) and misinterpreted as erroneous colour information. i.e. it reduces cross-colour
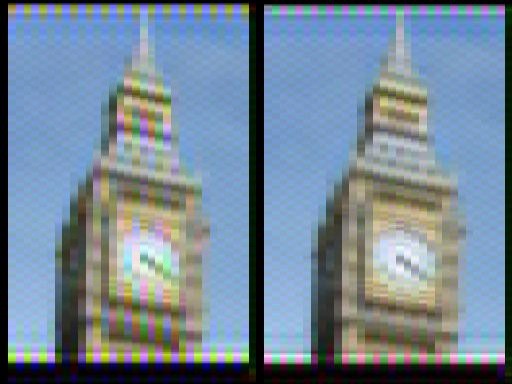
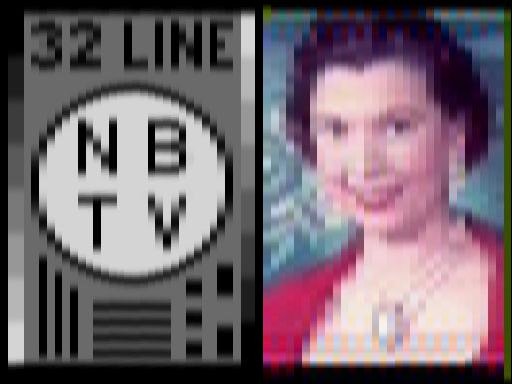
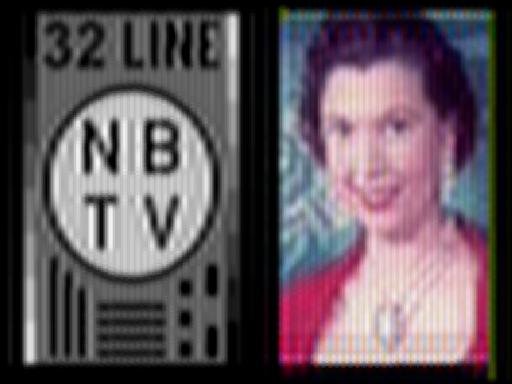
The figure above shows the effectiveness of the notch filter in reducing cross-colour. The unfiltered image on the left has erroneous coloured patterning evident on the clock face, this is due to the sharp luminence transitions around the clock hands and entablatures. In the filtered picture these sharp transitions have been filtered down so as to remove any components that would interfere with the sub-carrier components, as can be seen this has removed much of the erroneous colours on the clock face without noticeably marring the details.
There is however still some evidence of colour patterning at the top and bottom of the picture as the notch filter is not applied currently to the sync pulses which then upset the colour detectors as the sharp sync transitions contain high frequency components. No way has yet been found of shaping the sync pulses to satisfactorily reduce these cross-colour effects without adversely affecting the stability of synchronisation circuits. However the choice of the sync pulse width has been chosen to try and minimise these effects.
I/Q (or U/V) filtering applies filters to the I and Q channels before they are modulated onto the colour sub-carrier, or after they are demodulated during playback. When U/V playback is selected (as opposed to 4.2. Use IQ) the I filter is applied to both channels.
Different bandwidths are assigned to the I and Q channels during recording to ensure that when a C filter is finally applies which will restrict the sidebands of channels that there is no cross-talk between the channels.
The effect on the picture of the I/Q filters is that sharp transitions in the colour components are not reproduced correctly.
Some form of I/Q filtering is always applied at playback time otherwise sharp colour artefacts at twice the subcarrier frequency would make the picture unviewable.
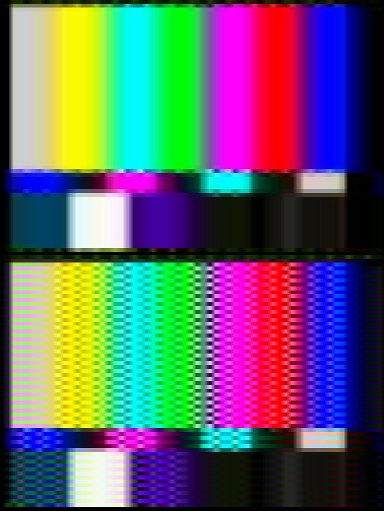
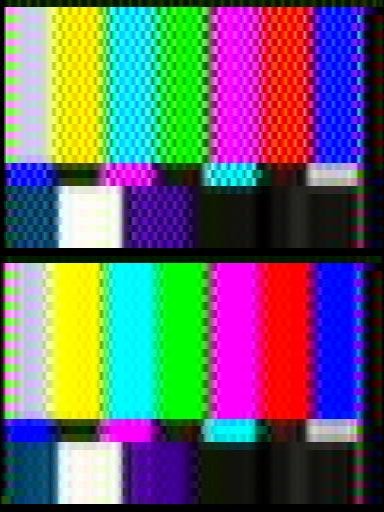
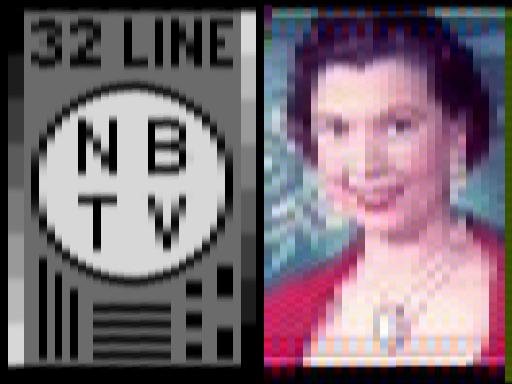
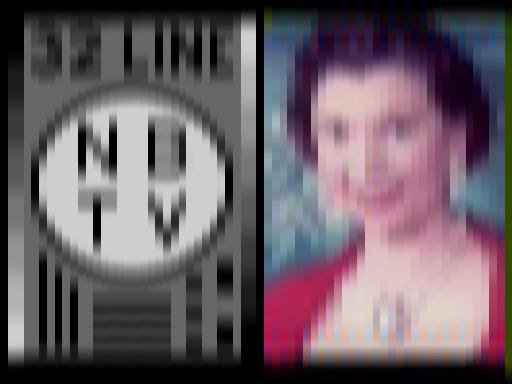
The figure above shows the unwanted effects of IQ filtering, the unfiltered (top) image has sharp neat transitions between the colour bars whereas in the filtered image the transitions are not as sharp. The filtering is applied at record time. Both pictures were made with the comb filter engaged to reduce the effects for cross-colour and dot-patterning to better exemplify the effects of IQ filtering.
One advantage of proper IQ filtering is that when the I and Q signals are properly filtered there is less cross talk between the I and Q channels at sharp colour boundaries. However this only becomes an issue when C filtering is also in place and this is only really necessary when the pictures are to be broadcast on a medium with a bandwidth of less than 17kHz.
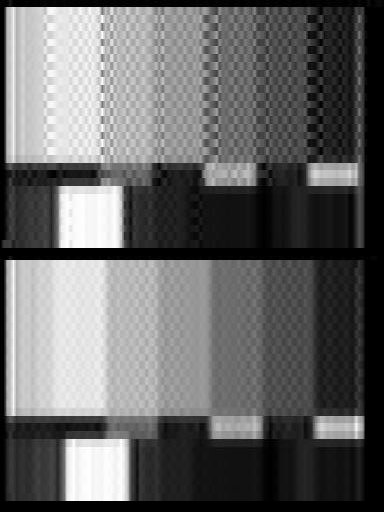
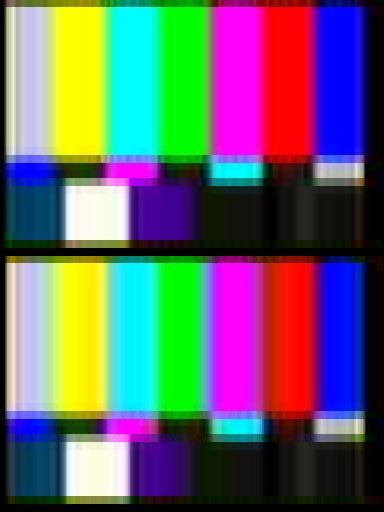
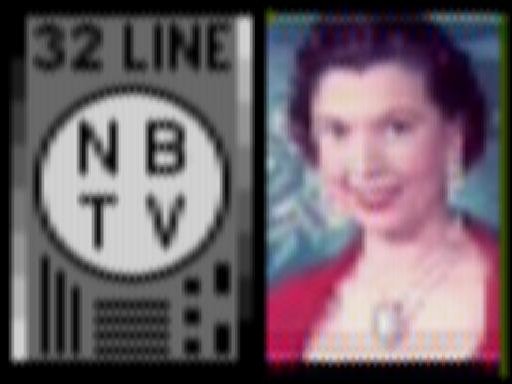
The other advantage of proper IQ filtering at recording time is shown above. The player is playing back two different test card files (with the same playback setings, with a Y notch filter engaged). The unfiltered (top) recording has high frequency I and Q components which when modulated onto the sub-carrier cause there to be colour components that fall outside the notch-filter's pass band, this leads to heavy dot-patterning, whereas the in the case of the bottom filtered image the dot patterning is reduced considerably although at the slight cost in colour sharpness.
The C filter can be engaged either in playback or record to simulate the effects of reducing the bandwidth of the combined chroma signal this tends to introduce cross talk between the colours at sharp boundaries which can be seen as incorrect colours. This filter is not much use other than for experimentation.
In all scanning television systems and in particular mechanical television systems the picture is made up by a "spot" of light which travels over the raster of the picture (in a CRT it is the size and shape of the cross-section of the electron beam).
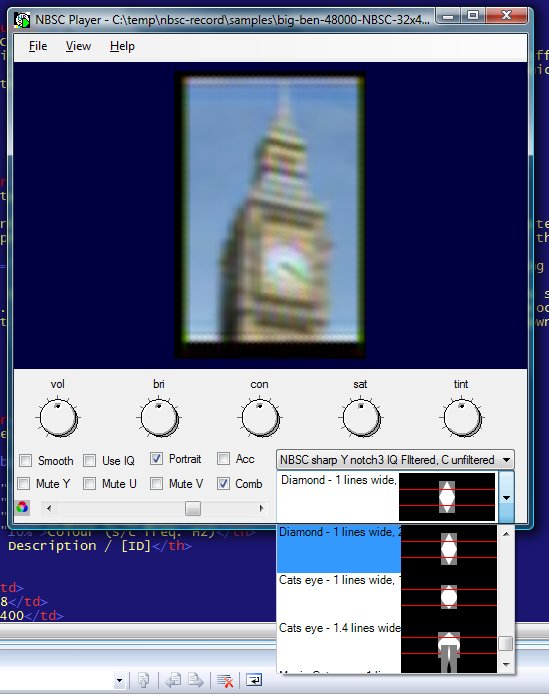
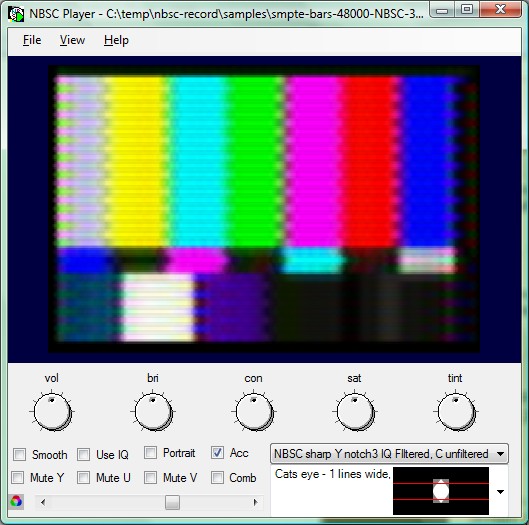
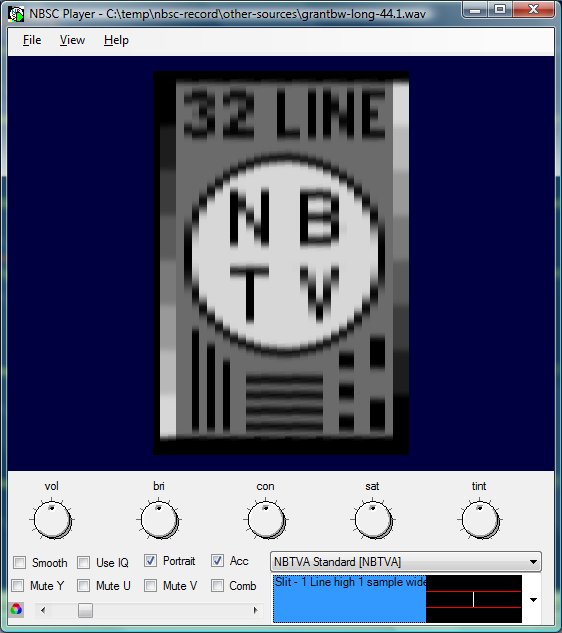
To simulate this the playback software has a number of pre-determined aperture shapes and sizes which can be applied when playing back files in any of the formats. The aperture simulation is only a rough approximation (to keep processing to a reasonable minimum) but the effects can clearly be seen. You can try out different apertures when playing back a file by using the drop down box in the bottom right corner of the screen. The drop down box shows a preview of the aperture. The red guide lines show the outlines of a single scanning line with the aperture superimposed.
When designing Nipkow discs (and to varying extent other devices) the size and shape of the aperture chosen is a compromise between the amount of light emitted (bigger the better) and the resolution accuracy (in general the smaller the better). The shape of the aperture can have all sorts of implications as well many of which are subjective, these are noted below.
Below are a few examples of apertures and their effects:

The aperture is one line high and one sample wide.
This aperture would not have a very great area and therefore in a mechanical system would have very inefficient optics. However, its power at resolving detail is the best. Note also that this aperture uses the least resources when using the player therefore is to be preferred on older or slower computers. Its subjective disadavantages are that it gives a very abrupt transition from one line to the other and that high frequency noise and dot-patterns are pronounced. In reality such an aperture is not practicable for mechanical TV but might be acheiveable using "spot wobble" on a CRT monitor

The aperture is 80% of a line high and one sample wide.
This aperture is like the slit one above but shows the marked deterioration in quality when there is a misregistration between the lines.

The aperture is two lines high and one sample wide. The slit is more transparent towards the centre of the scan line and tapers towards the edges.
This aperture is like the standard slit however, it is two lines high, which blend the transitions between lines, and the light throughput is greater at the centre of the scan line falling off towards the edges of the aperture. This allows one scan line to blend seemlessly into another. Whilst this would be difficult to realise in a mechanical system it could be effected in a CRT monitor using a spot wobble with a suitable envelope. The subject improvements are that there is a gradual blending of the scan lines reducing harsh - blocky edges. In some ways this makes a test card look more blurred but for real life pictures gives an improvement in realism.

This aperture has reasonable resolution and a good size area and is often the first choice of many constructors when making Nipkow discs. Its subjective disadavantages are that it gives a very abrupt transition from one line to the other and that high frequency components are attenuated.


This aperture has good resolution and a reasonable area (light output is 2/3 of that of the square) and is often the first choice of many constructors when making Nipkow discs. Its subjective disadavantages are that it gives a very abrupt transition from one line to the other.

This aperture has terrible resolution but a huge area (light output 3x that of a square). Its subjective disadavantages are that it gives a very abrupt transition from one line to the other and that the image is blurred.


This aperture has good resolution along the line but a large area (light output 1.33x that of a square). Its subjective disadavantages are that it gives a blurred abrupt transition from one line to the other although resolution is preserved along the line.
This aperture has good resolution along the line but a large area (light output 1.33x that of a square). Its subjective disadavantages are that it gives a blurred abrupt transition from one line to the other although resolution is preserved along the line.

This aperture has good resolution along the line and a large area (light output 1.75x that of a square). Its subjective advantages are that it gives a good resolution and a good blending between the lines, its disadvantage is that on abrubt changes in luminance the diamond patterning is noticeable. It could be realised well in a Nipkow disc monito given a suitable punch.

This aperture has excellent resolution along the line and a large area (light output 1.75x that of a square). It is much like the diamond above but with improved resolution along the line at the expense of a reduction in area (light output is same as square). The patterning of the larger diamond is much less pronounced giving a real life picture of excellent quality.

This aperture has excellent resolution along the line and a reasonable area (light output roughly that of a square). It is much like the narrow diamond above but with improved resolution across the line at the expense of a reduction in area (light output is same as square). The patterning of the diamonds is less pronounced giving a real life picture of excellent quality. There is a certain prounciation of the raster that I suspect is a function of inaccuracies in the simulation rather than the choice of aperture shape!

This aperture is not actually realisable in real life as it actually has negative light output on every other line. However it is intended to show the effect of applying an aperture whose width and light output follow the sinc function as advised by Nyquist. This has a few weird effects but gives the impression in real life pictures of improving resolution across the lines by artifically sharpening abrupt changes - this leads to some ringing as can be seen on the test card.
The "scope" window can be accessed by using the View->Scope or by pressing the F2 button. This displays an extra window which acts like a multi-channel oscilloscope which can be used to monitor the various signals used in the decoding process.
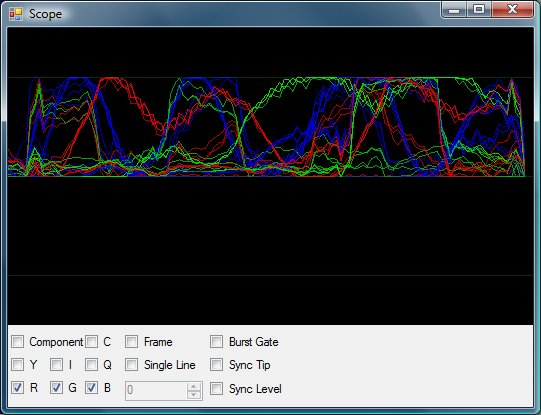
You may select which signals are displayed by clicking the tick boxes next to each signal's name. The various signals are listed below.
Resizing the window will give a larger display but on slower machines will cause playback to become choppy and sound to break up.
By default the scope will trigger each line, showing all lines on top of each other, however options are available to trigger at a particular line only or to trigger once per frame.
The component video signal
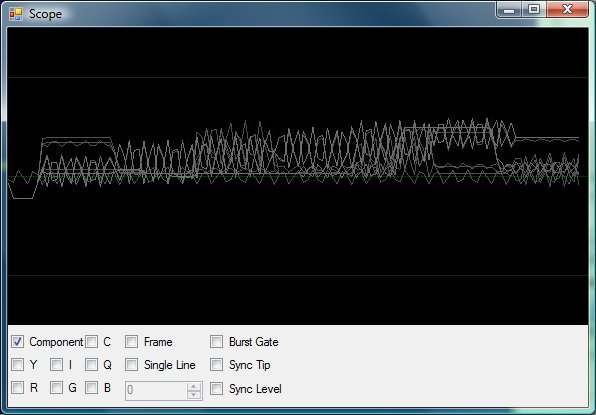
This is the component video signal i.e. what is read directly from the .wav file
The luminance signal
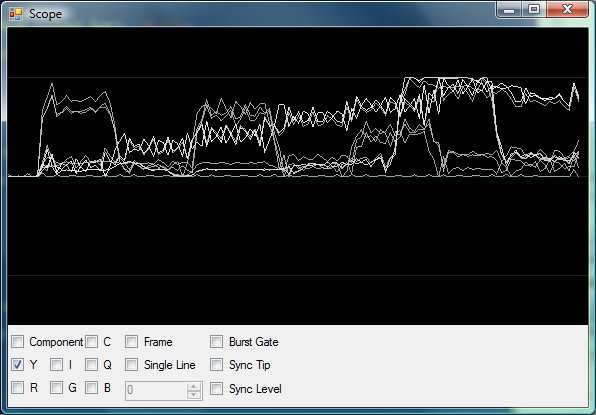
This is the Y or luminance signal this is after any Y notch filter and the brightness and contrast controls have been applied. As can be seen above the colour patterning is less pronounced than the component video after passing through the notch filter.
The chroma signal
This is the C or chroma signal this is after any C filter but before the saturation control.
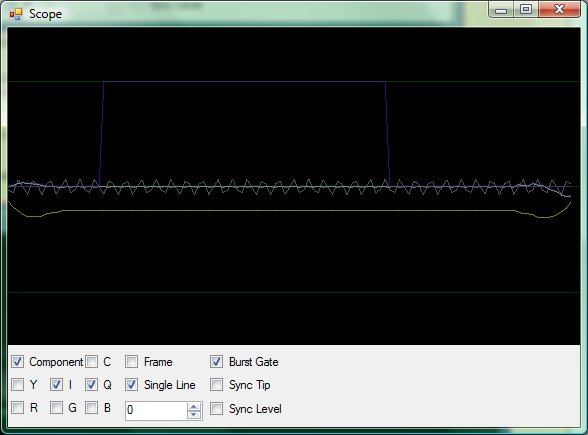
The I and Q signals (or U, V)
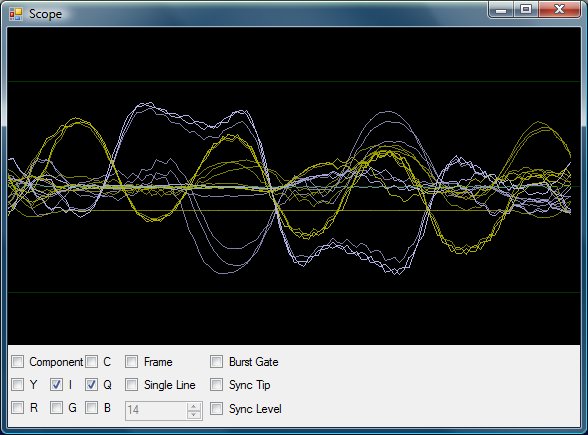
Shows the U and V (or I and Q if "Use IQ" is enabled) after being demodulated, any I,Q filtering and the saturation control.
The Red, Green and Blue output signals
Shows the Red, Green and Blue output signals as they are plotted to the screen after all controls. But before any aperture simulation.
"Sync tip" level
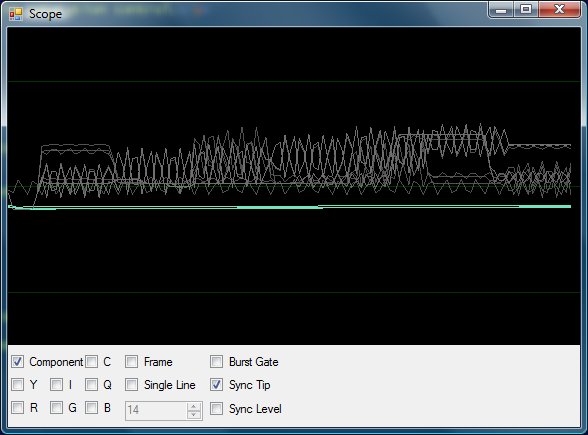
Shows the "sync tip" level, this is the level of the last sync tip detected, this falls towards the centre line during a line (Even further during a missing sync line) to allow the software to automatically adjust for changing signal levels. "Sync level" is the level below which a line sync pulse will be detected it is slightly lower in magnitude than a "sync tip" to allow for noise.
Trigger on Frame (missing sync) rather than a line
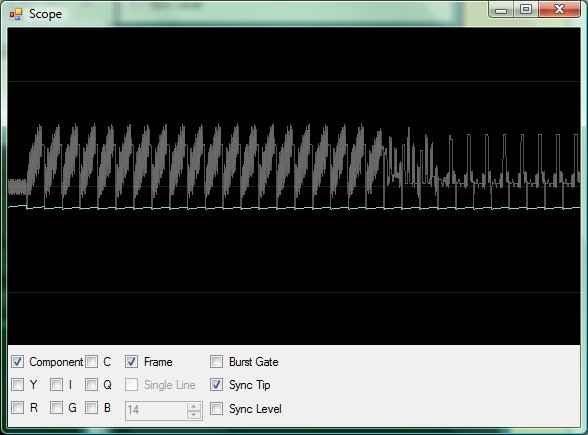
Shows a whole frame's worth in a single sweep rather than a line's worth.
Trigger on a particular line
Shows only a single line's worth of information - this can be used to pick out details, such as the colour burst - see "burst" below. Once single line is selected use the up and down arrows next to the text box below the "single line" option to select which line to show.
show at which point the colour burst is being sampled
A vectorscope is an instrument used in the TV industry for aligning the colour circuits of a television channel. It can be used to quickly asdjust the Hue/Tint and Saturation controls.
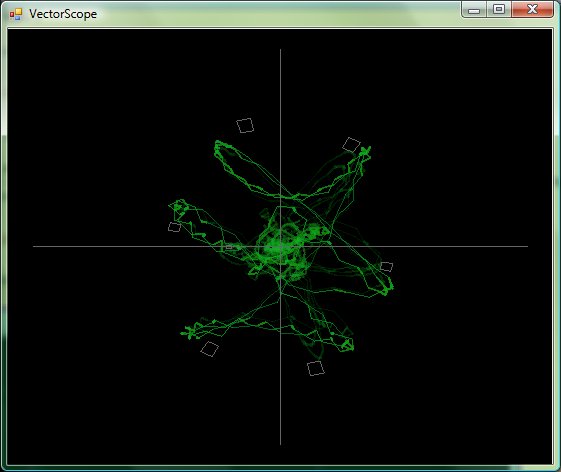
The vector scope shows the decoded I and Q (or U and V) signals in a two dimensional graph. When the saturation and hue controls are set correctly the tips of the "star" should line up with the large graticules (one for each colour), and the colour burst should line up with the small graticule.
The Scrape NBSC program can be used to record video material from any item that is open on your desktop.
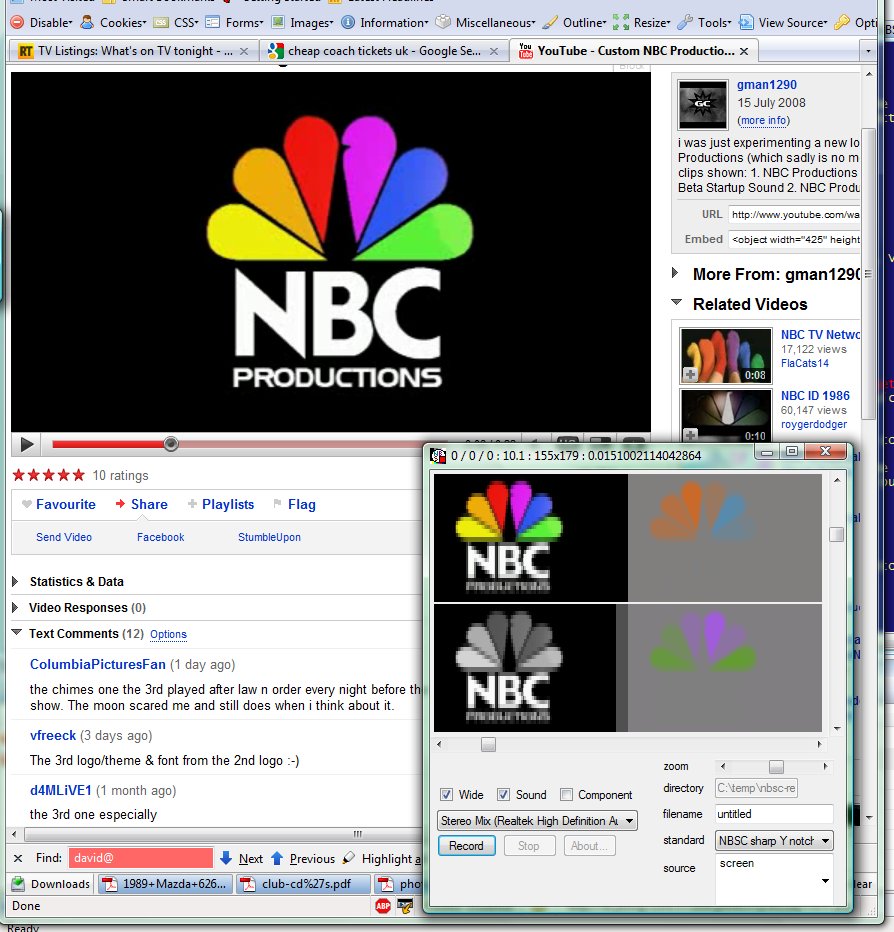
The figure above shows the NBSCScrape program being readied to capture a video from YouTube. The video is paused in Firefox and the small window in the foreground is the NBSCScrape program.
When scraping a video you must ensure that the area of the screen to be "scraped" stays in the same place and is uncovered during recording.
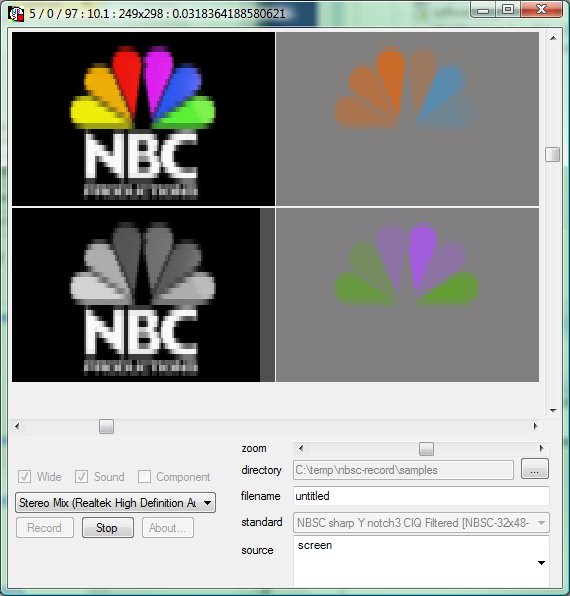
The figure above shows the Scraper actually capturing a video. The numbers in the title bar show the number of frames skipped / number of frames dropped / number of frames recorded : zoom level : X x Y coordinates of top left : processor time taken to encode a frame.
The scraper only records in 48kHz WAV format
The controls are as follows:
The top portion of the screen shows a preview of what is being captured, you may resize the window to get a bettwe view, but that will reduce the area of desktop which you can capture! The four preview areas show the full-colour, black and white and I and Q previews.
Use the scroll bars to move the capture area around the desktop until you have framed the area you wish to capture.
This option controls whether the capture is in wide-screen or portrait mode.
This option controls whether sound is also captured. If sound is enabled you must have a sound source available to windows, and use the drop down box below the options to select the sound device to use.
Most of the time you will want to record the sound that is being output by the computer at recording time, on XP and 2003 this is a special sound device called "what U hear". In Windows Vista this is disabled by default but can be reenabled by following the simple instructions here. If you do not have the Stereo mix option available you may have to route your sound output to your microphone input using a lead.
For colour formats the chroma information will be recorded in a seperate third sound channel to obviate problems of cross-colour and dot patterning.
Press this button to start recording, you will be prompted before overwriting an already existing file!
Press this button to stop recording.
Use this slider to zoom in or out the area to be "scraped"
Use the "..." button to pop up a dialog to allow you to select the directory where recorded files will be stored
Type the name of the file you want to create in here, don't include the .wav extension, the program will automatically append this and the ID of the format chosen.
Use the dropdown to select the Standard you wish to record to.
Use this drop down to select the source for the video either from the screen or a selection of simple test cards.
I usually follow the following steps when I wish to record a video:
| Record / Playback | Lines / cols | Frame, Line (Hz) | Colour (s/c freq. Hz) | Name / Description / [ID] |
|---|---|---|---|---|
| Both | 32 x 48 | 12.5, 400 | NBSC (15000) |
NBSC sharp Y notch3 IQ FIltered, C unfiltered Y,I,Q filtered (15kHz notch (>12db from 12.5kHz up), 1.5kHz, 0.5kHz). A sharp (15kHz) notch filter in the luminance, improved cross-colour (for record) and dot-structure (playback) at cost of poorer luminance definition. C is unfiltered. [NBSC-32x48-12.5-c15000-YN3IQ] |
| Both | 32 x 48 | 12.5, 400 | NBSC (15000) |
NBSC sharp Y notch3 CIQ Filtered Y,C,I,Q filtered (15kHz notch (>12db from 12.5kHz up), 15.5kHz lp (20db down at 16kHz), 1.5kHz, 0.5kHz). A sharp notch filter in the luminance, improved cross-colour (record) and dot-structure (playback) at cost of poor luminance definition. [NBSC-32x48-12.5-c15000-YN3] |
| Both | 32 x 48 | 12.5, 400 | NBSC (15000) |
NBSC gentle luma Y,C,I,Q filtered (15kHz notch (5db), 15.5kHz lp (20db down at 16kHz), 1.5kHz, 0.5kHz) lower colour definition slightly improved cross-colour (record) and dot-structure (playback) [NBSC-32x48-12.5-c15000] |
| Record | 32 x 48 | 12.5, 400 | NBSC (15000) |
NBSC Unfiltered
No channels are filtered, improved luminence and chroma definition, cross-colour is worst [NBSC-32x48-12.5-c15000-Unfiltered] |
| Both | 32 x 48 | 12.5, 400 | NBSC (15000) |
NBSC IQ Filtered I/Q (U/V) channels filtered (1500Hz,500Hz), reasonable colour definition, cross colour unaffected [NBSC-32x48-12.5-c15000-IQFiltered] |
| Both | 32 x 48 | 12.5, 400 | NBSC (15000) |
NBSC CIQ Filtered C/I/Q (C/U/V) channels filtered (1500Hz,500Hz), reasonable colour definition, cross colour unaffected, Chroma bandwidth kept below 15500Hz (20db down at 16000Hz) [NBSC-32x48-12.5-c15000-CIQFiltered] |
| Both | 32 x 48 | 12.5, 400 | NBSC (15000) |
NBSC sharp Y notch Y,C,I,Q filtered (15kHz notch (?db), 15.5kHz lp (20db down at 16kHz), 1.5kHz, 0.5kHz). A sharp notch filter in the luminance, improved cross-colour (record) and dot-structure (playback) at cost of poor luminance definition. [NBSC-32x48-12.5-c15000-YN] |
| Both | 32 x 48 | 12.5, 400 | NBSC (15000) |
NBSC sharp Y notch2 Y,C,I,Q filtered (15kHz notch (>42db), 15.5kHz lp (20db down at 16kHz), 1.5kHz, 0.5kHz). A sharp notch filter in the luminance, improved cross-colour (record) and dot-structure (playback) at cost of poor luminance definition. [NBSC-32x48-12.5-c15000-YN2] |
| Record | 32 x 48 | 12.5, 400 | NBSC (15000) |
NBSC sharp Y notch3, CIQ Unfiltered Y filtered (15kHz notch (>12db from 12.5kHz up)). A sharp notch filter in the luminance, improved cross-colour (record) and dot-structure (playback) at cost of poor luminance definition. [NBSC-32x48-12.5-c15000-YN3-Unfiltered] |
| Both | 64 x 96 | 12.5, 800 | NBSC (15600) |
NBSC 64, IQ Filtered 64-line, I/Q (U/V) filtered (3000Hz, 1500Hz), reasonable colour definition, cross colour unaffected [NBSC64-32x48-12.5-c15000-IQ-filtered] |
| Record | 64 x 96 | 12.5, 800 | NBSC (15600) |
NBSC 64 Unfiltered 64-line, no filtering, colour has more definition with worst cross-colour [NBSC64-32x48-12.5-c15000-UnFiltered] |
| Record | 64 x 96 | 12.5, 800 | NBSC (15600) |
NBSC 64, YNotch3, CIQ unfiltered 64-line, Colour is unfiltered for improved definition, luminance is 12db notch filtered to reduce cross colour (record) and dot-structure (playback) [NBSC64-32x48-12.5-c15000-YN3-Unfiltered] |
| Both | 32 x 48 | 12.5, 400 | B&W |
NBTVA Standard Normal Club standard B&W [NBTVA] |
| Both | 48 x 64 | 12.5, 600 | B&W |
NBTVA Standard - 48 line 48 line - Club standard B&W [NBTVA48] |
| Both | 64 x 96 | 12.5, 800 | B&W |
NBTVA Standard - 64 line 64 line - Club standard B&W [NBTVA64] |
| Playback | 32 x 48 | 12.5, 400 | CCNC |
Klaas/Vic CCNC Vic Brown & Klaas Robers' digital only colour [NBTV-CCNC] |
| Both | 32 x 48 | 12.5, 400 | NBSC (15006.25) |
X-NBSC CIQ Filtered C/I/Q (C/U/V) channels filtered (1500Hz,500Hz), reasonable colour definition, cross colour unaffected, Chroma bandwidth kept below 15500Hz (20db down at 16000Hz) - half frame S/C offset [X-NBSC-32x48-12.5-c15000-CIQFiltered] |
| Record | 32 x 48 | 12.5, 400 | NBSC (15006.25) |
X-NBSC Unfiltered No channels are filtered, improved colour definition but cross-colour is unaffected, half frame subcarrier offset [X-NBSC-32x48-12.5-c15000-Unfiltered] |
 NBSC
NBSC